-
• #2
Excellent! I like it a lot... quite a while back I built a GPS display - DIY Marine GPS using enhanced GPS Module, u-blox NEO-6M GPS receiver, and ILI9341 Module controlled 2.8" Color TFT LCD after Exploring 2.8" Color TFT Touch LCD by Pac Man Game attempt.
You have to get creative to overcome the speed issues... doing graphics over a serial line is challenging.
For the GPS, I update only stuff that has changed, and in the pac man game I used just two lines to animate the 'eater'.
Since you deal you can also use fixed fonts rather than vector fonts and scale them... it is a bit jagged then, but it is much faster. Drawing and filling is the challenge.
There are also parallel controlled displays out there... they are much faster, but you have to sacrifice GPIOs...
Bangle.js is 8-bit parallell serial...that is the reason it's displaying much faster.
Totally different path is to use segment displays rather than dot displays. Dot displays are always slower... and 'high'-resolution display are worse, because of use of so many dots.
Take a look at Large Display: x by y w/ 24 bpp Graphics buffer visualized with neopixel string in zig-zag layout. There I use neopixel - serially controlled - but use Espruino's Graphics capabilities:
- The application writes to a graphics object using the convenient graphics features
- A background process updates the display by just reading out the buffer of the graphics object and 'shoving it down the throat' neopixel string.
You find all kinds of display projects among my Espruino forum posts...
- The application writes to a graphics object using the convenient graphics features
-
• #3
Hi - this looks great! It's really nicely laid out on-screen.
How are you using the LCD? Via direct mode, or paletted: http://www.espruino.com/ILI9341
If you're careful with direct mode you might get the rendering going a bit faster, but flickering is an issue. One option is to modify the paletted mode renderer so that you can have a smaller offscreen buffer just big enough for your numbers, you can render offscreen, and then upload just the area for the number to the screen, which should be quite a bit faster
-
• #4
Thank you so much for the advice. It's good to have a lively community.
I have not yet figured out how to work with the buffer, and in general, I have huge problems understanding how binary code should work.
For starters I just changed the font .as I was advised. The rendering speeded up many times over, but the numbers were less beautiful. So I made those readings that change very fast in one font, and those that change slowly in a pretty font.Readings of gear and acceleration (0-100km/h) will be calculated on the basis of speed and engine speed, because I do not want to install a sensor for gear selection.
For clarity, I screwed setTimeout to the speedometer, so it was clear at what speed the readings change. In fact, the data on the speedometer meter will be different (not in increments of 1km/h).
Not to run to the bike, I think to build an emulator for speedometer and tachometer.
I will be glad to hear suggestions on code optimization. Is it possible to make "Vector" font to be displayed with the same speed.
If you choose the color outside the body of the class, the code works, but if the method of the class (line 10 of code), then for some reason the color does not changeA3.set(); // light on require("Font7x11Numeric7Seg").add(Graphics); SPI1.setup({sck:A5, miso:P2, mosi:P3, baud:10000000000000000}); var g = require("ILI9341").connect(SPI1, A2, A0, A1, function() { g.clear(); g.setRotation(1); g.drawLine(5, 171, 315, 172); g.drawLine(5, 75, 235, 75); g.drawLine(70, 36, 235, 36); g.drawLine(160, 175, 160, 235); g.drawRect(240, 0, 320, 140); g.drawRect(0, 0, 65, 71); g.fillRect(240, 123, 320, 143); g.fillRect(0, 60, 65, 71); g.fillRect(120, 175, 160, 195); g.fillRect(160, 215, 200, 235); g.fillRect(193, 15, 235, 35); g.fillRect(70, 36, 120, 56); g.setFontVector(21); g.setColor('#000000'); g.setFontVector(19); g.drawString("GEAR",257,125); g.setFontVector(13); g.drawString("0-100",15,60); g.setFontVector(21); g.drawString("km",126,175); g.setFontVector(21); g.drawString("odo",165,215); g.setFontVector(21); g.drawString("rpm",195,14); g.setFontVector(21); g.drawString("temp",71,37); g.setColor('#ffffff'); g.setFontVector(21); g.drawString("km/h",215,149); g.setFontVector(39); g.drawString("C",198,40); }); setTimeout(()=>{ let parameters ={ speedometer:{ x:140, y: 80, font:{name:"7x11Numeric7Seg",size:8,hight:88,color:'#ffffff'} }, tachometer:{ x:170, y:1, font:{name:"7x11Numeric7Seg",size:3,hight:33,color:'#ffffff'} }, gear:{ x:250, y:5, font:{name:"Vector",size:130,hight:60,color:'#00ff00'} }, temperature:{ x:170, y:40, font:{name:"Vector",size:39,hight:24,color:'#ffffff'} }, odometer:{ x:295, y:176, font:{name:"Vector",size:40,hight:20,color:'#ffffff'} }, run:{ x:100, y:200, font:{name:"Vector",size:40,hight:20,color:'#ffffff'} }, acceleration:{ x:25, y:20, font:{name:"Vector",size:30,hight:20,color:'#ffffff'} } }; class Counter { constructor(value) { this.value = value; } countSym(number,param) { number = number.toString(); let oneSym = { value: number.split("").reverse(), posX: param.x, posY: param.y, font: param.font }; this.value = oneSym; } renderNum (numForRender) { g.setColor(this.value.font.color); g.setFont(this.value.font.name,this.value.font.size); let number = numForRender.toString().split("").reverse(); let step = g.stringWidth(number[0]); for(let i = 0; i<number.length; i++){ if(number[i]!==this.value.value[i]){ if(i===0){ g.clearRect(this.value.posX,this.value.posY,this.value.posX + step,this.value.posY + this.value.font.hight); g.setColor(1,1,1); g.drawString(number[i], this.value.posX, this.value.posY); }else{ g.clearRect(this.value.posX - i*step,this.value.posY,this.value.posX - (i===1?0:(i-1)*step),this.value.posY + this.value.font.hight); g.drawString(number[i], this.value.posX-step*i, this.value.posY); } } } this.value.value = number; } } let speedometer = new Counter(0); speedometer.countSym(1,parameters.speedometer); speedometer.renderNum(0); let tachometer = new Counter(0); tachometer.countSym(1,parameters.tachometer); tachometer.renderNum(12000); let gear = new Counter(0); gear.countSym(1,parameters.gear); gear.renderNum(6); let temperature = new Counter(0); temperature.countSym(1,parameters.temperature); temperature.renderNum(98); let odometer = new Counter(0); odometer.countSym(1,parameters.odometer); odometer.renderNum(1140); let run = new Counter(0); run.countSym(1,parameters.run); run.renderNum(42657); let acceleration = new Counter(0); acceleration.countSym(1,parameters.acceleration); acceleration.renderNum(3); for(let i = 0; i<=200; i++){ speedometer.renderNum(i); } }, 500); -
• #5
Cool, very nice!
Some hints:
g.setFontVector -> g.setFont("Vector",19) or even g.setFont("Vector19")
it is possible to combine g functions like this
g.setFont("Vector19").drawString("GEAR",257,125);speed of linedraw - rotation has side effects on drawing speed, check module ILI9341 and datasheet to add rotation to the driver. This should also speed up drawString with Vector font.
This is working for me:
// TFT_MADCTL: Memory Access Control (orientation) switch (ROTATION) { case 1: cmd(0x36, 0); break; default: cmd(0x36, (0x80 | 0x20)); break; } -
• #6
Watched you clip...
I think the measuring cycle and the display cycles and processes should. be independent / asynchronous and 'virtually' simultaneously, both triggered by their own intervals or interval and timeout, and any rendering to the display should happen only if data has changed, with once a while a display of data that has not been displayed for a while. With that in place you get the best out of both model/data and view worlds.
For simulation, you can take a second board with which you produce the events and values for the first one.
You can also use the Testing and Monitoring feature built into Espruino Web IDE to not only drive your board but also monitor it, display behavior in a graph with lines and even record the monitor results. In settings enable the Testing feature and setup some testing configurations.
-
• #7
I tried changing the orientation of the display. I didn't notice any increase in rendering speed. The Vector font still draws very slowly.
-
• #8
The readings will be outlined differently than in the video because the bike reaches 100km/h in less than 4 seconds. The speed sensor is a magnet attached to the wheel and an electromagnetic sensor that is triggered when the magnet passes near it. Readings will come in 0, ~22,~44,~57..... It might be worth creating another variable to store the time it takes to render one character or the whole number. Then as soon as a reading is shown on the display, the next reading from the sensor will be read and shown immediately.
And here is the question, whether using :setWatch(callback, pin [, opts])Will this method be able to trigger the tachometer frequency (14000 rpm)?
-
• #9
@NoobJS, it depends what the callback has to do... 14000 / 60 = 234 events per second... You can try...
The setup for doing something like that is usually a bit different: a counter is connected to the pulse sensor and is made to measure for a calibrated time. The counts are then translated into RPM. Checkout this https://www.espruino.com/STM32+Peripherals out.
With the setWatch() you may try by making sure nothing else is eventing and watch only for a given time.
-
• #10
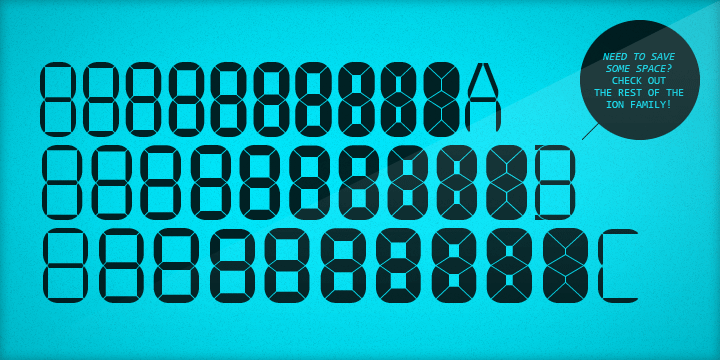
Since you deal you can also use fixed fonts rather than vector fonts and scale them... it is a bit jagged then, but it is much faster. Drawing and filling is the challenge.
The question is why drawing a line is much slower than drawing a rectangle.
https://youtu.be/aYKweXBdzTc
  g.drawLine(0, 110, 320, 110);
  g.setColor(0,1,0);
  g.drawRect(0,130,320,130);
  g.setColor(1,0,0);
  g.drawLine(150, 0, 150, 240);
  g.setColor(0,0,1);
  g.drawRect(170, 0, 170, 240);
Is it possible to make a fast font of fixed size?
-
• #11
Drawing a rectangle vs drawing it with 4 lines is faster because a rectangle is always aligned with x and y (x or y constant for any of the lines and y and x is increasing/decreasing integer) and there is never the question which pixel to turn on, where as a line can have have x and y changing because a line can have a slope, and much more math and decision making is involved. Line drawing could be optimized by looking at the slope and have different implementation for it, line one for where either x1 and x2 or y1 and y2 are equal, slope modulo is equal, less or more than 45 degrees.
Large smooth fonts use a lot of space. Since you need though only digits, it is significantly less than a complete character set. Furthermore, your 7-segment pic gives me the idea of combining defining (masked) graphics (buffers) of each segment and then copy the segments into the display buffer - like composing the digits - before sending out the display buffer.
Espruino 2v10 just introduced bit blit Graphics.blit() for such a thing... unfortunately it has no mask / transparency support... so you have to build that for yourself to be able to copy overlapping rectangles into a target buffer where only part of the source buffer should override. If you write some inline C it will be very fast... Next, you have to find a display that is not single. bit serially controlled but parallels to 8 or 16 bits (depending the GPIO pins you can spend/waste on the display...
Inline C is easy and very fast... I did some it in the conversation about Efficiently moving things around in zig-zag Graphics buffer visualized w/ 24/32 bpp displays / neopixel strings. Since you do not need all the colors, you can use a very small source buffer of just 2 bits color depth and copy into the 'full-color' tarbet buffer according the target buffer's color depth. *in graphics below, the blue background inside the red box of each of the segments is considered transparent and pixels of it will not overwrite the corresponding target pixels.
Feedback from @Gordon: there are already provisions for that using .drawImage(...), .asImage(...), and more.
1 Attachment
-
• #12
Drawing a line being slower is actually pretty confusing since the system should be able to recognise flat lines and turn them into fillrect commands.
I feel like the big issue here is really just the LCD driver and being able to push data fast enough.
Do you think you'd be in a position to build your own firmware? I know you're on the Amperka board and I think their builds are some way behind Espruino - however if you could build your own firmware there is actually a native SPI LCD driver in https://github.com/espruino/Espruino/blob/master/libs/graphics/lcd_spi_unbuf.c
If you could include that, suddenly updates would get miles faster
-
• #13
Unfortunately, my experience is not enough to create the firmware. I know programming superficially, and haven't worked with electronics much, I spent most of my working life repairing cars =).
I found a manual in my native language, detailing what commands are needed to work with the display. And I think I understood why it's impossible to make a nice smooth font. What I don't understand is the speed of the SPI port on my controller.The maximum interface speed should be up to 20megabit, but I guess it all comes down to the speed of the controller port.
Of course I can buy another display and another controller in general e.g. raspberry and connect the display to another level. But we are not looking for easy ways =). You can ride with the dashboard you have on the bike now. But I like to invent something. So I hope to see it through to the end. -
• #14
I think the delay you're seeing is likely due to the JavaScript display driver more than anything else. Moving to a 'native' driver would likely speed things up a lot. Because it's not an official board you won't get the ability to add Inline C, but you could probably modify the ILI9341 library to use assembler for the setPixel and fillRect functions.
- Accessing IO with assembler (your board is an SMT32F4 I think): http://www.espruino.com/Assembler#stm32f4-espruino-pico-
- The setPixel/fillRect functions that need implementing: http://www.espruino.com/modules/ILI9341.js
- Accessing IO with assembler (your board is an SMT32F4 I think): http://www.espruino.com/Assembler#stm32f4-espruino-pico-
-
• #15
Oh-ho-ho-ho, assembler is no longer easy. But maybe I'll try to figure it out later. I decided to remove the rev display completely, so as not to interfere with the speedometer display. The tachometer will be a scale made of LEDs anyway.
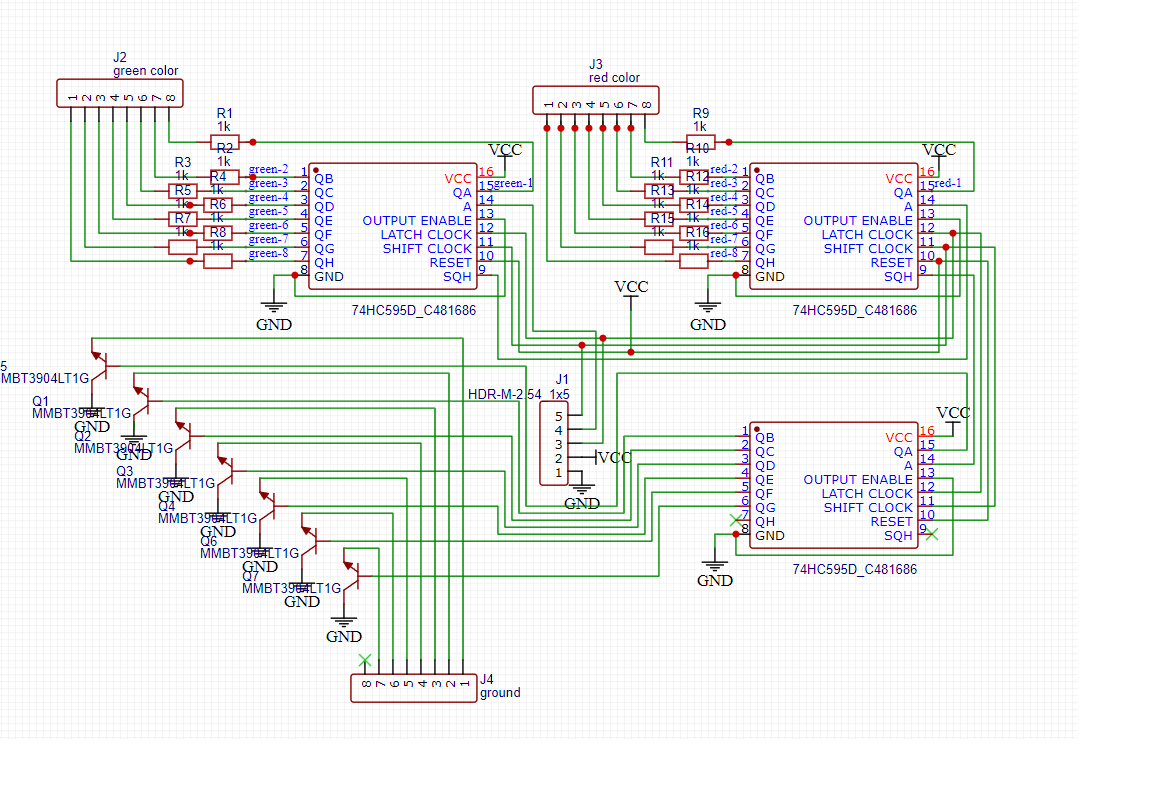
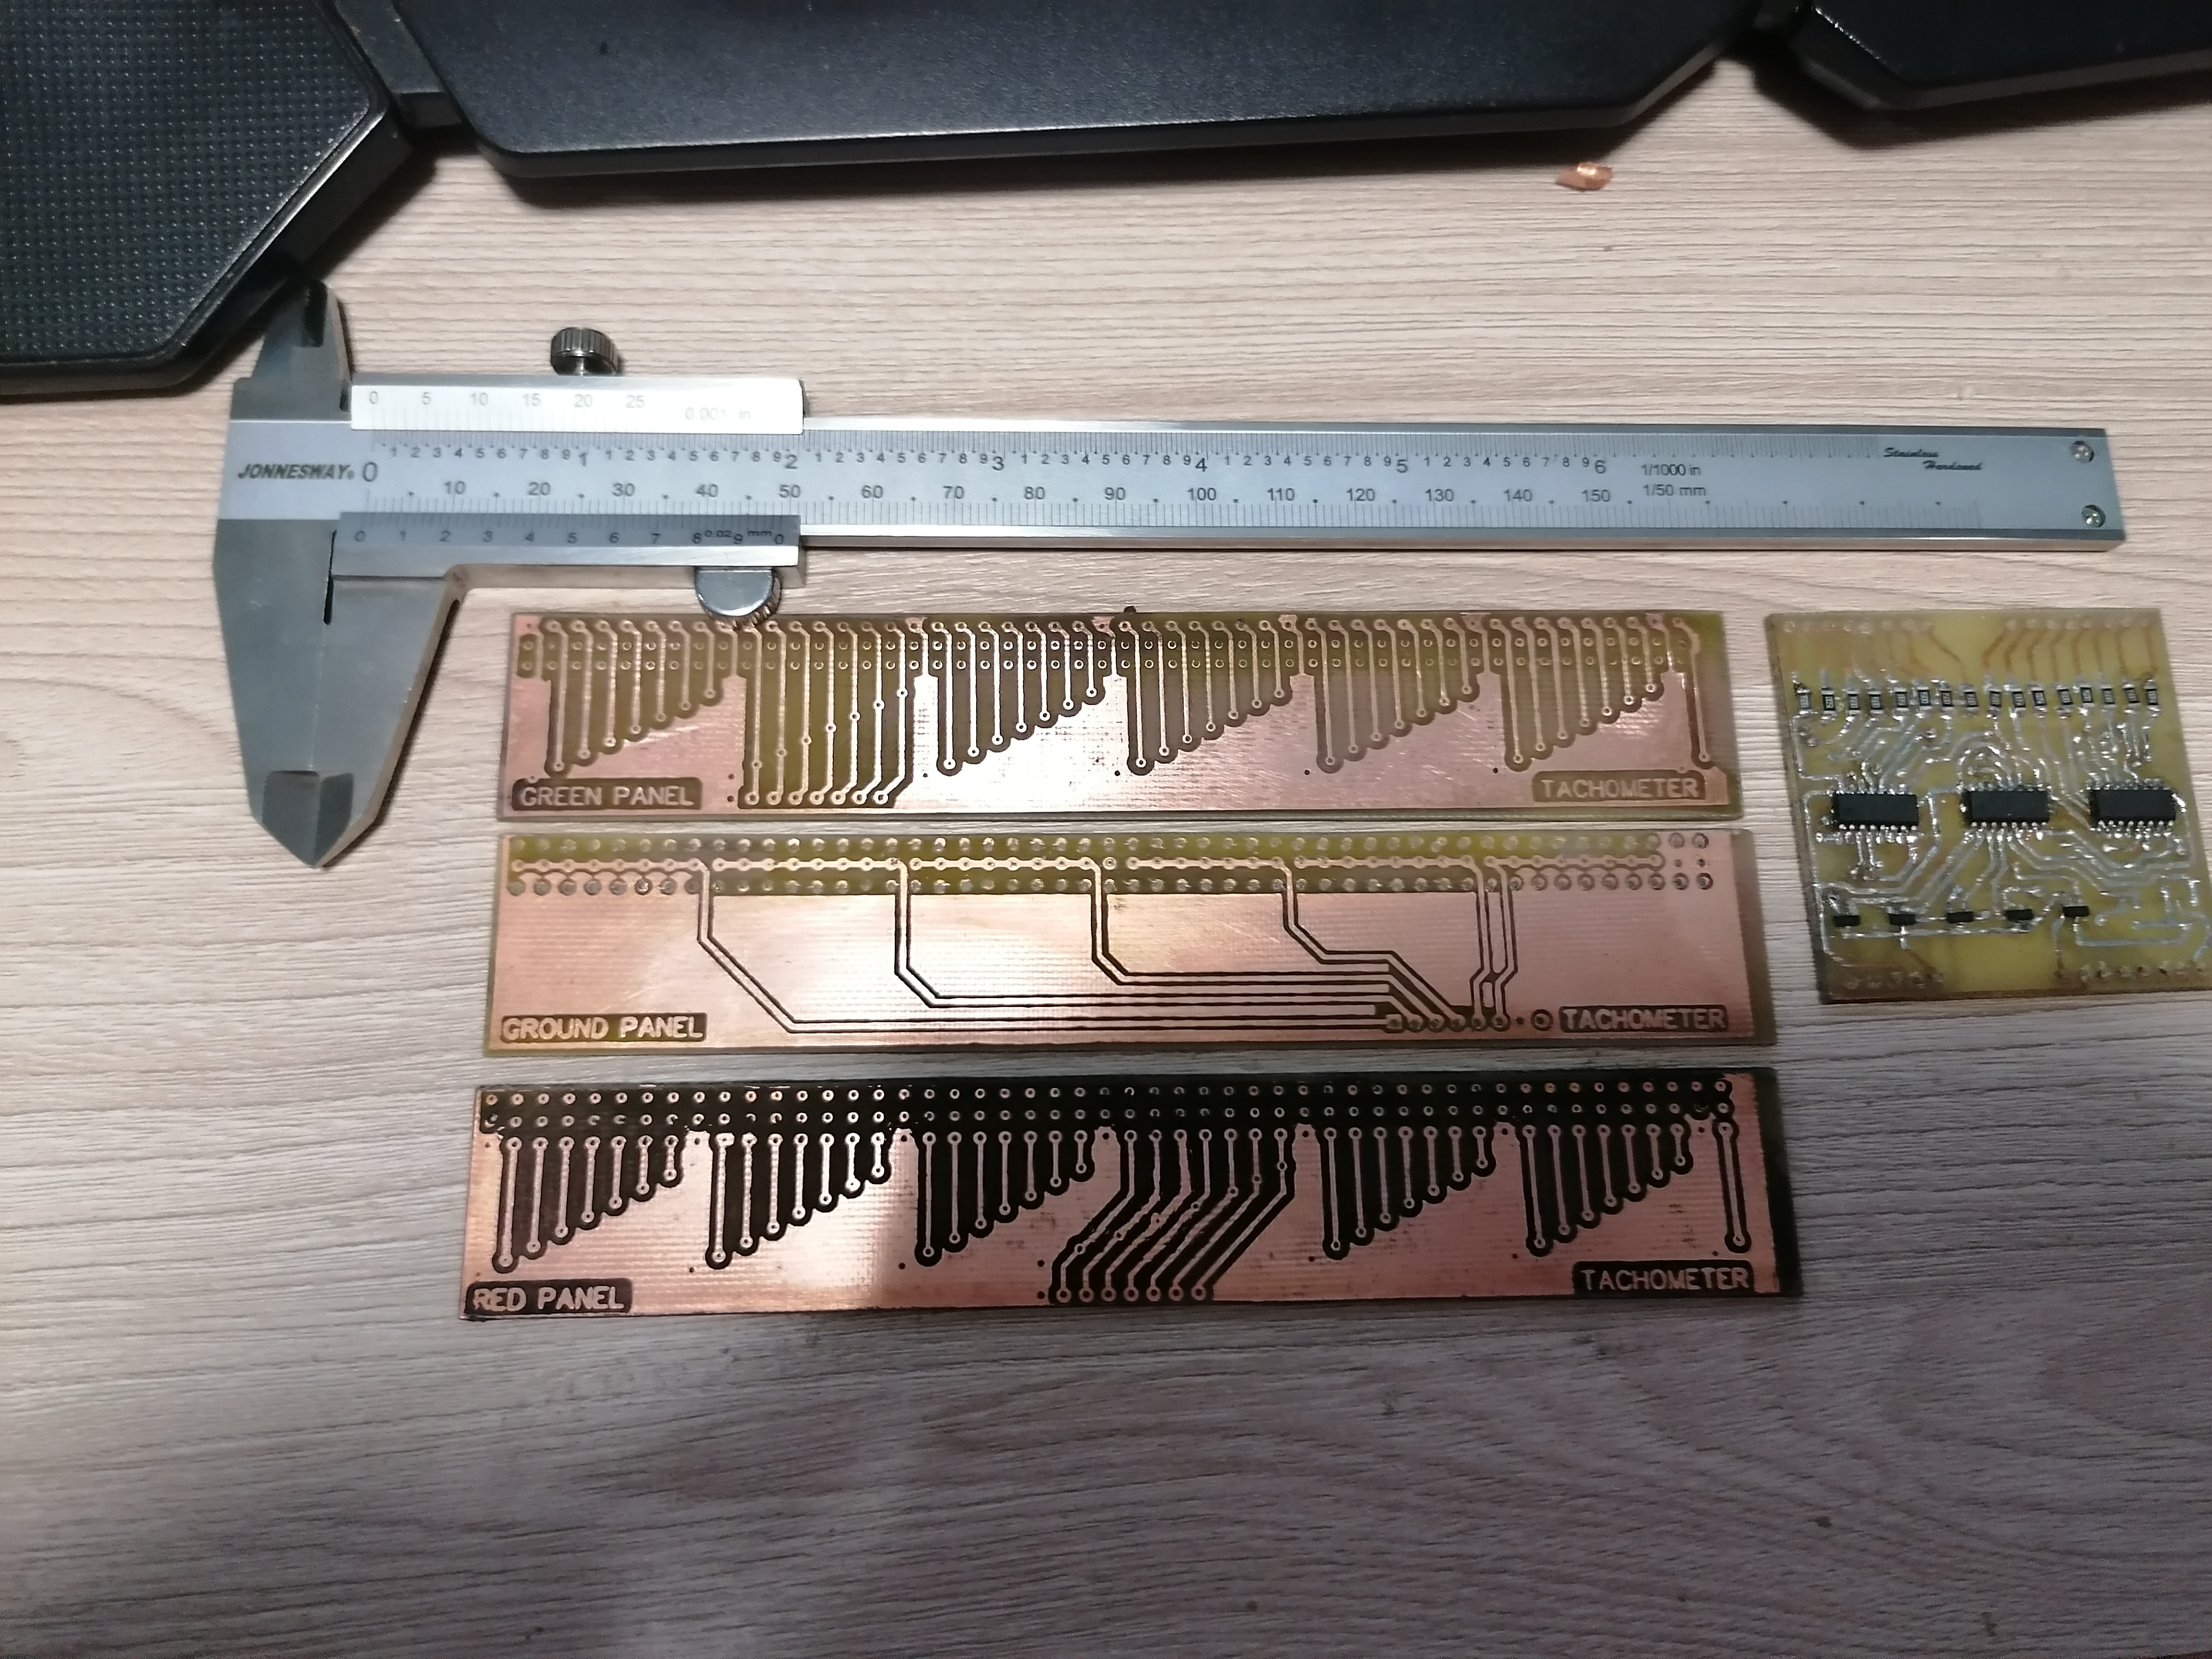
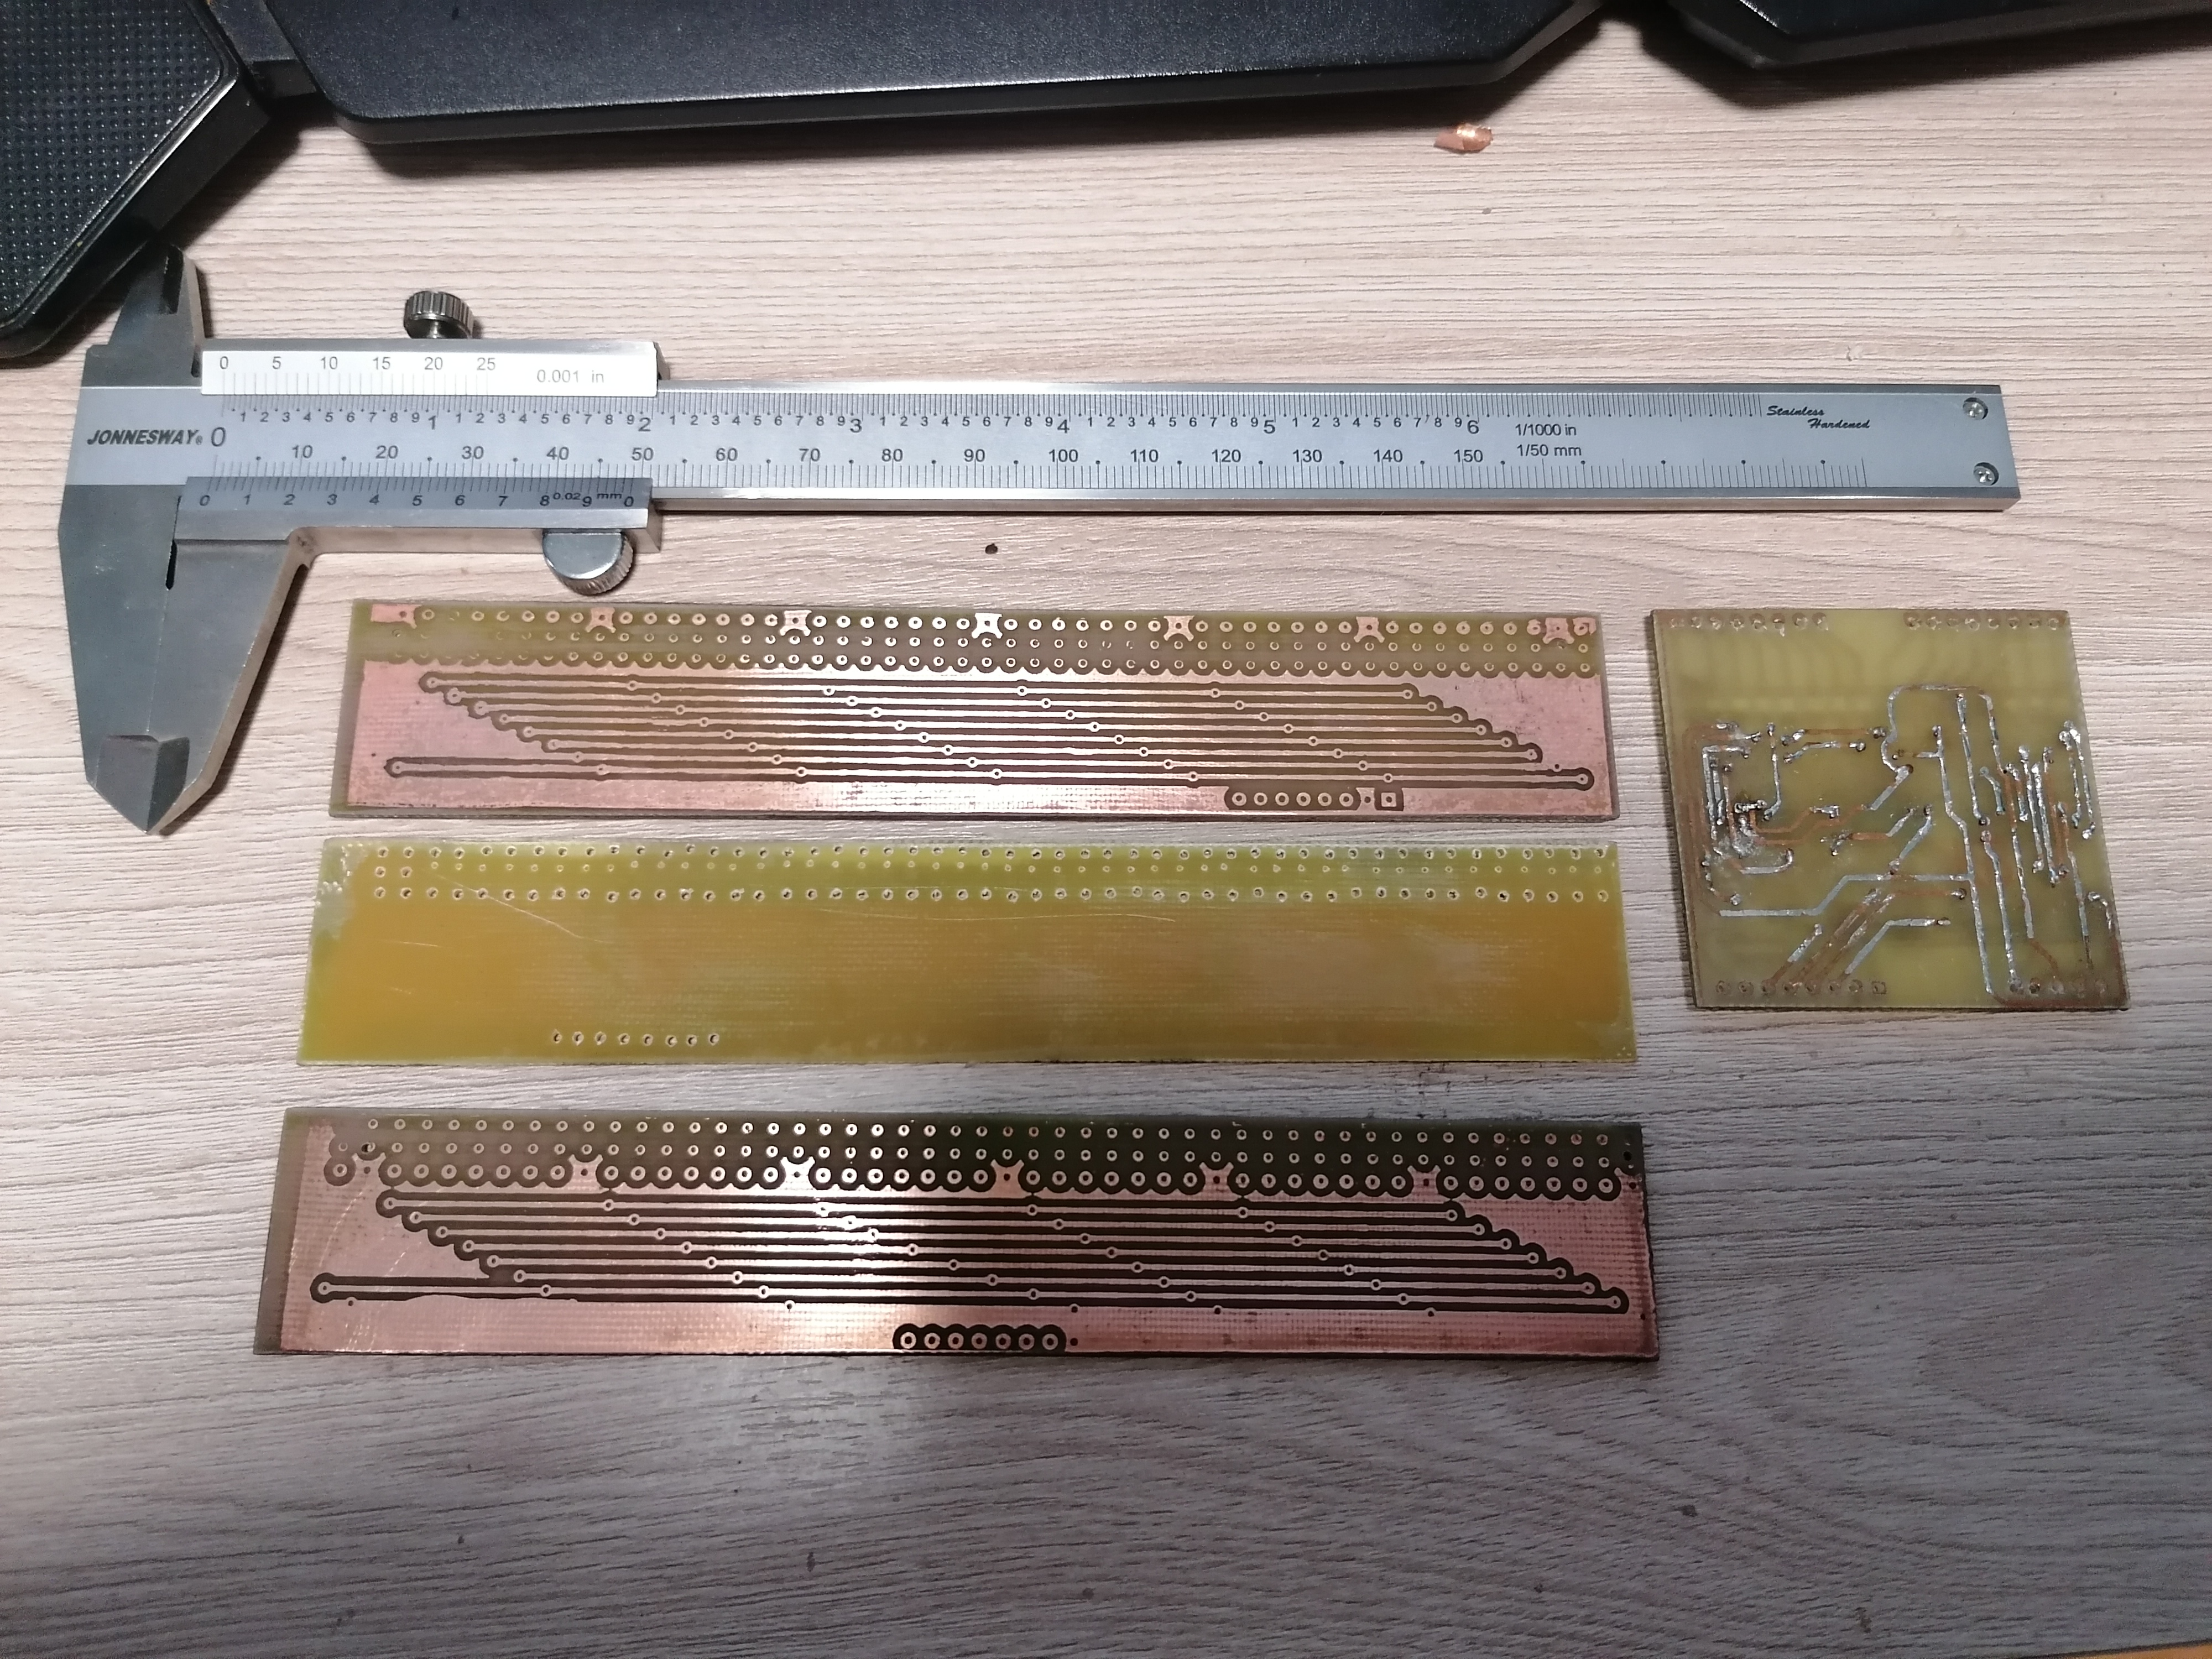
I decided to build a driver to control the tachometer, it will use dynamic indication.
4 Attachments
 allObjects
 Gordon
 NoobJS
 MaBe
MaBe
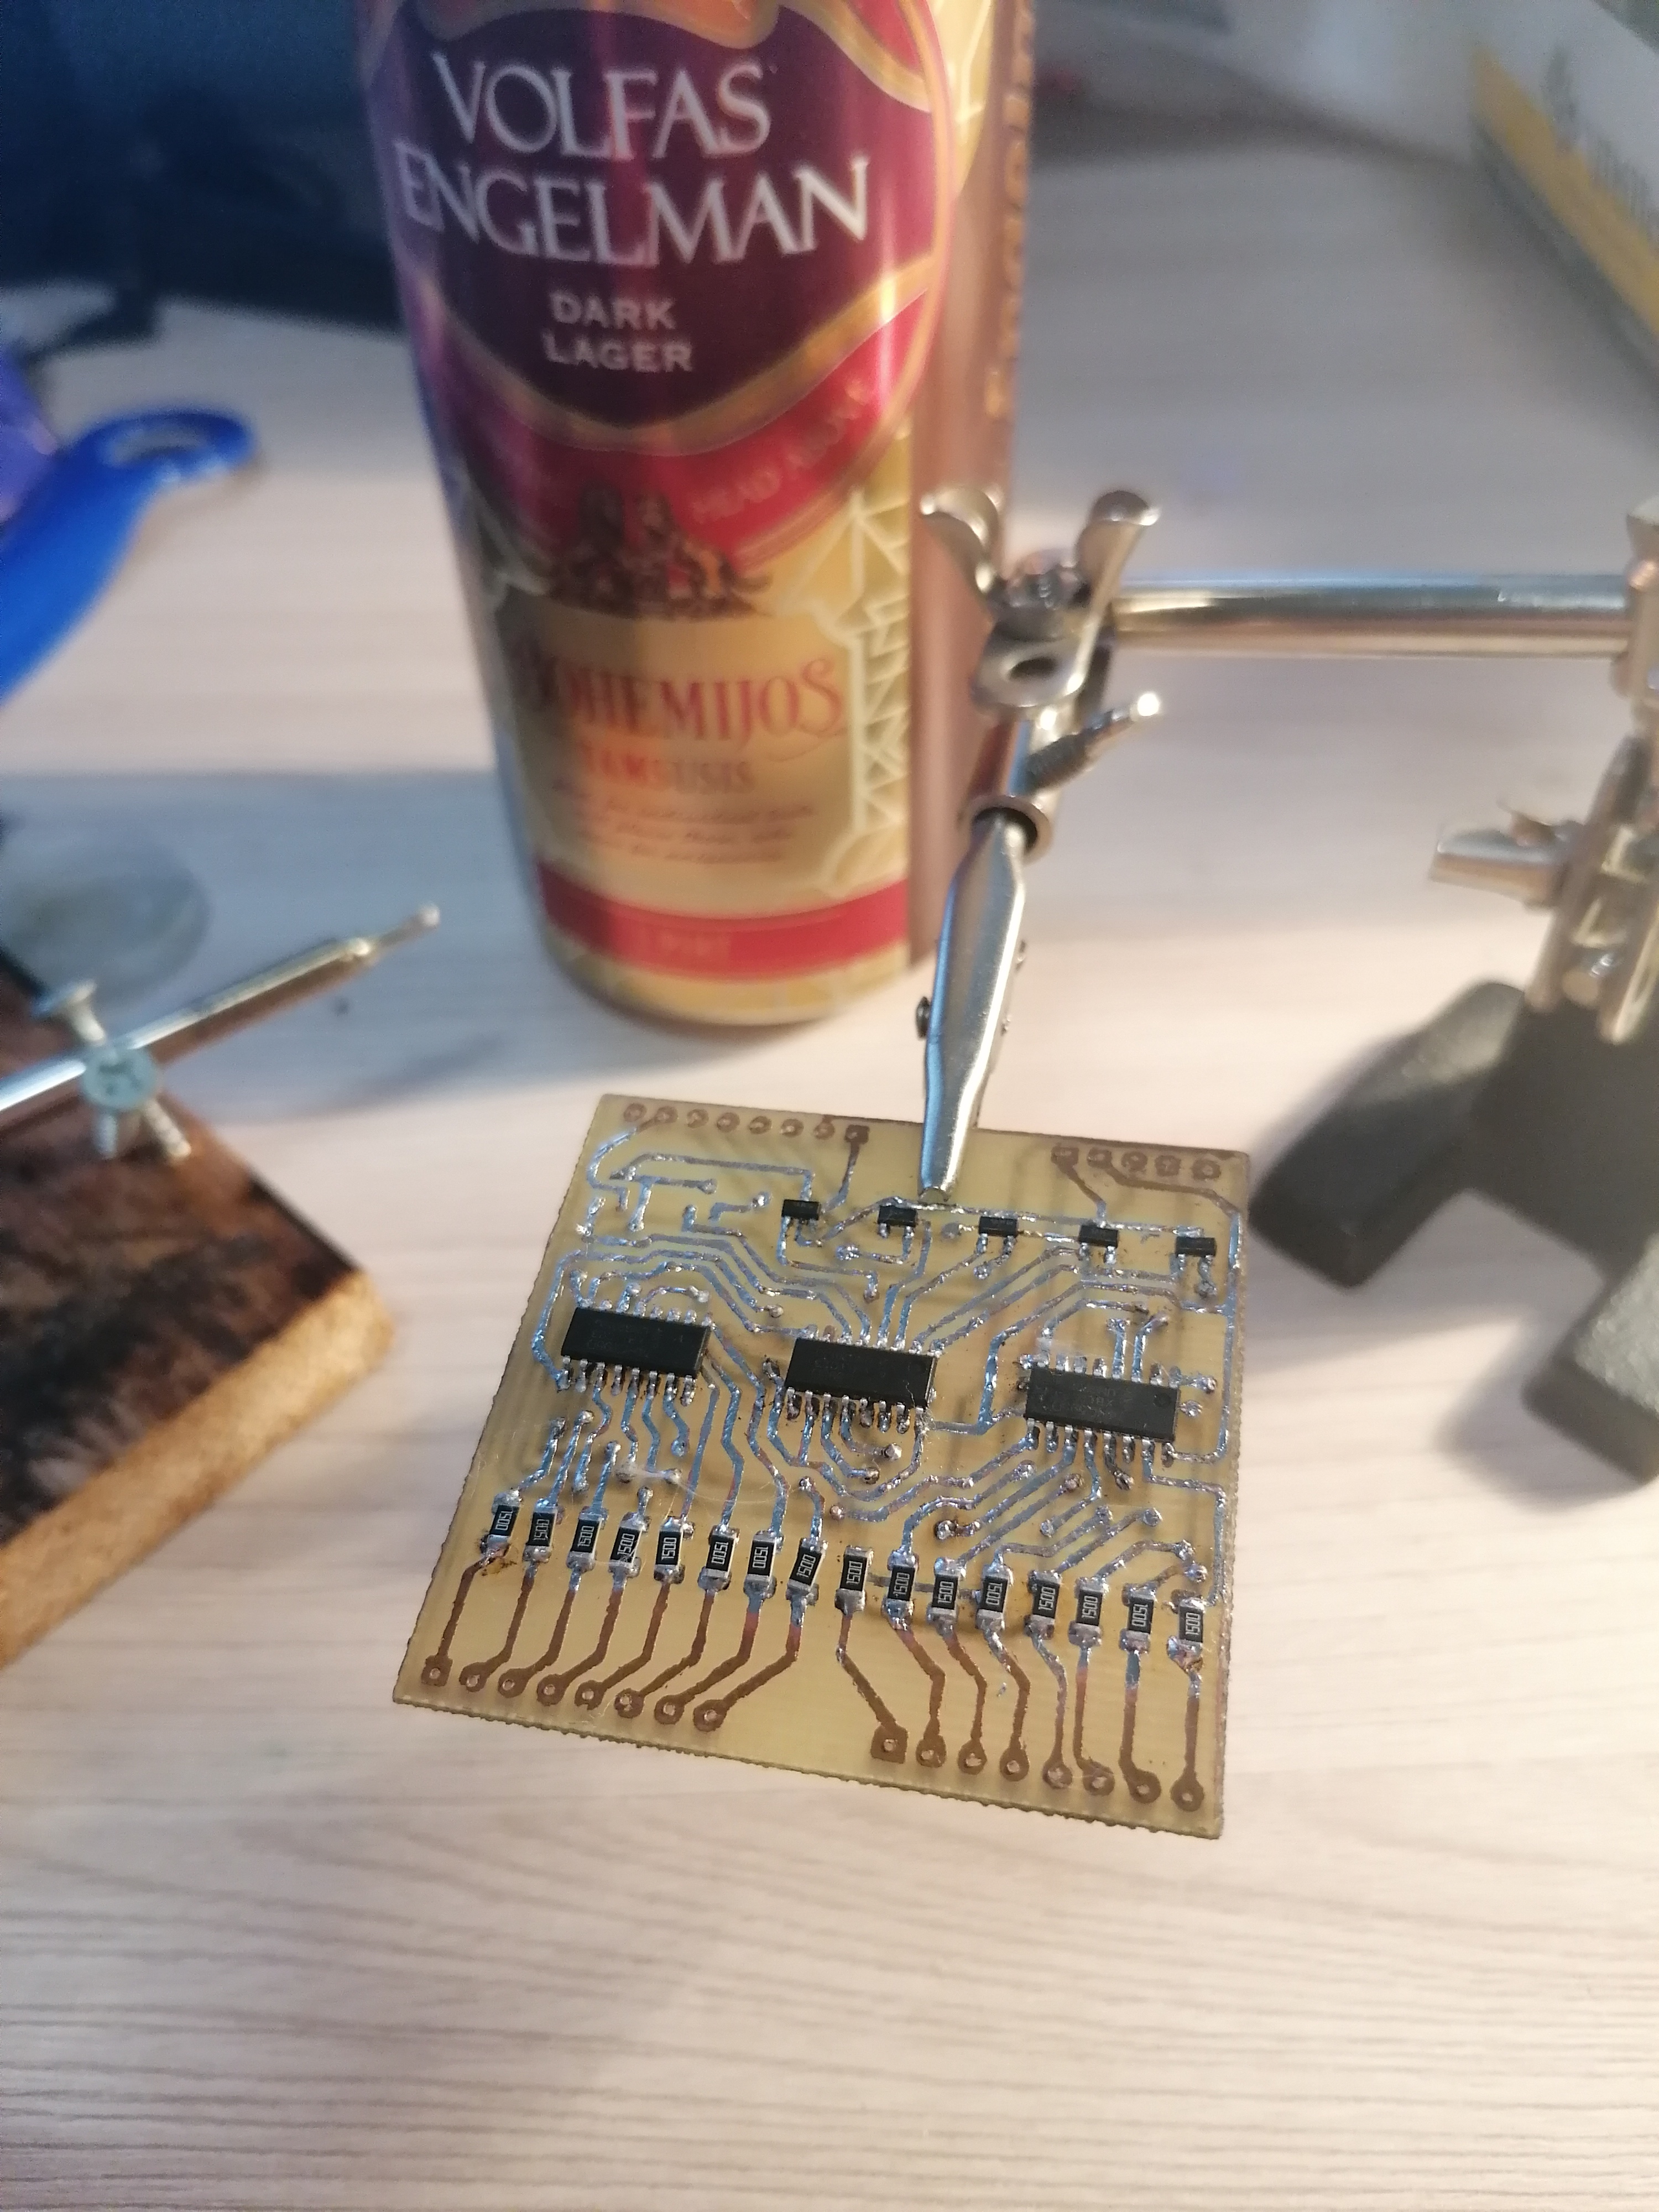
Hi all.
This is my first post on your forum. Please excuse my poor English, because it is not my native language.
I decided to make a dashboard for my '98 Honda cb600 motorcycle. I chose IskraJS module because I have experience in writing code in java script.
I want to make a tachometer from 50 two color LEDs connected through a bunch of unl2803+74hc595. And the display will show: speed, engine temperature, mileage, selected transmission...
While I figured out how to connect it all, but ran into a problem, too slow rendering images on the screen. If you can put up with the initial rendering, then on the road I would like to draw the numbers faster. Позже добавлю видео работы и код, а пока только фото
1 Attachment